Analyzing Your AdWords Ads
This is the final post in our series on creating and analyzing Google Ads (AdWords) ads. In the previous installments we’ve covered:
- Creating a Google Ads Text Ad
- Creating a Google Ads Image Ad
- Using the Google Ads Display Ad Builder
- Creating Google Ads Video Ads & Mobile Ads
This post will focus on analyzing the AdWords ads you’ve created.
How to Analyze Your Ads within the Google Ads Interface
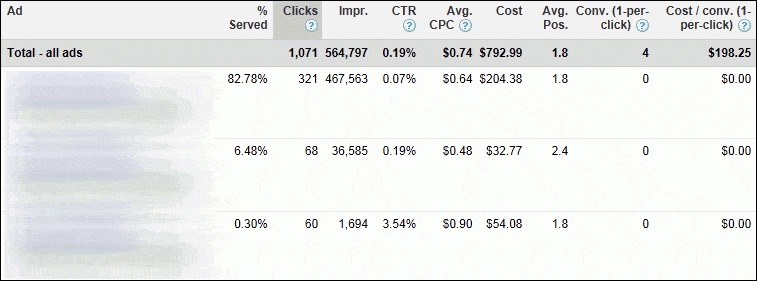
If you’re looking to evaluate the performance of your ads, an obvious first step is to take a look within the Google Ads interface to see how ads are performing. Here you can do things like customize date ranges, look at cost, click, impression, and conversion data, and quickly make changes to your ads:
This is a very useful view and interface if you’re optimizing ads on an ad group by ad group basis. For smaller campaigns, this really may be all you need for measuring ad peformance. You can quickly glimpse:
- Click-through rate, which will impact your Quality Score
- Share of voice across the ads, impressions per ad, the cost being pushed to each ad, and which ads are showing in higher positions
- Conversion and cost data
You want to be sure to take Quality Score and strong click-through rates into account, but of course the main driver behind your decision on which ads to designate as winners and losers should be conversions and profitability.
The trouble with the Google Ads interface is mainly scale. I can compare these metrics, then pause the ads that didn’t win, then create new ad copies. The problem is if I have a larger account I may have to do this across hundreds or thousands of ad groups. This means I need to be able to analyze and edit multiple ads at once.
One helpful feature here is to set up a filter based on ad text performance data. You can find the Filter menu in the Ads tab:
This can help you cut through some of the noisier data to find out things like which ads have a cost per conversion that’s unprofitable, which have particularly low click-through rates, etc., if you’re analyzing data across a large number of ads.
Finally, within the interface you can also use Google Ads Campaign Experiments for ad copy testing.
Analyzing Your Ads within Google Ads Editor
Google Ads Editor is a free desktop application offered by AdWords specifically to help to advertisers handle “bulk edits.” Within Google Ads Editor you can quickly make bulk changes to ads (for instance, if you need to move the landing page your ads are driving to, you can quickly change several ad destination URLs at once) but Google Ads Editor doesn’t offer a view of actual ad text performance.
Analyzing Your Ads within Microsoft Excel
The single most popular tool for analyzing ad text data among PPC advertisers who manage large-scale campaigns is Excel. Excel allows you to make bulk edits and leverage advanced formulas to slice and dice your data, as well as activating and pausing ads and even altering ad creative in bulk.
There are a lot of ways to test, analyze and optimize ads in Excel. Below you’ll find a collection of great resources for analyzing AdWords ads in Excel. Many of these were created by our friend Chad Summerhill and Richard Fergie, who seem to be far and away the most active creators of ad analysis content, but if you know of additional posts or articles we missed, please leave them in the comments.
By leveraging the resources below, you’ll be able to get a lot of great insight into large sets of ads using Excel:
- Peer Comparisons, Statistical Significance, Cross Ad Group Testing, and Visualizing Ad Results – Each of the following posts offer a means of leveraging Excel to get deeper and more actionable insights into the performance of your ad text:
- Cross Ad Group Testing
- Visualizing Your Ad Test Results
- Peer Comparisons in PPC Data Analysis
- PPC Ad Testing for Statistical Significance
- Re-creating the Google Ads Dashboard in Excel – This is the last in a great series on the WordStream blog on re-creating the Google Ads dashboard, which should give you some good ideas on how to visually represent data and port information from AdWords to Excel.
- Ad Text Maths – For an in-depth look at some of the statistical and mathematical logic behind ad data analysis this post offers some great information.
- Analyzing Google Ads Data – This is actually about Tableau Software and is a few years old, but a lot of the information holds true, and Tableau is another great tool for analyzing ad data.
Meet The Author
Tom Demers
Tom Demers is Co-Founder & Managing Partner at Measured SEM and Cornerstone Content.
See other posts by Tom Demers
More Articles Like This
Comments
Please read our Comment Policy before commenting.


