Google Analytics Multi-Channel Funnels: How to Use Multi-Channel Tracking & Attribution
Despite being somewhat overshadowed by slightly more interesting tech news yesterday, the Google Analytics blog made a big announcement: multi-channel funnels are now available to everyone.
First of all, I want to call out that this is very likely great news for anyone who makes their living optimizing Google AdWords accounts. Why? Because I have a sneaking suspicion that before they rolled this feature out for everyone (and particularly for multi-million-dollar-a-month spenders) they took a look at whether or not the data was, shall we say, “flattering” to paid search – and particularly AdWords – traffic. The same is likely true for search engine traffic in general, so if you’re optimizing websites for paid or organic search, you probably just got another weapon in your value demonstration arsenal.
This is a major announcement as it further rounds out their already robust analytics offering. Attribution is a major issue for anyone attempting to determine which channels or keywords are responsible for conversions, as well as how people are actually interacting with their site.
How Do Google Analytics Multi-Channel Funnels Work?
First of all: what are we even looking at here? The multi-channel funnels show you how people are converting on your site and what got them there, so they’re focused around sales and conversions (typically leads or sales, but basically anything you’ve designated as a goal in your analytics account). This is the information you need for multi-touch attribution modeling.
Google Analytics Multi-Channel Overview Report
First, let’s take a look at the overview reporting functionality:
This is a pretty cool report – what we can get is a snapshot of what channels are involved in what conversion processes. Tactically there’s not a lot we can do here yet, but if you’re new to an account (a client account for instance) you can get a quick idea of the share of voice for different channels, as well as how one channel is impacting another. Really interesting data!
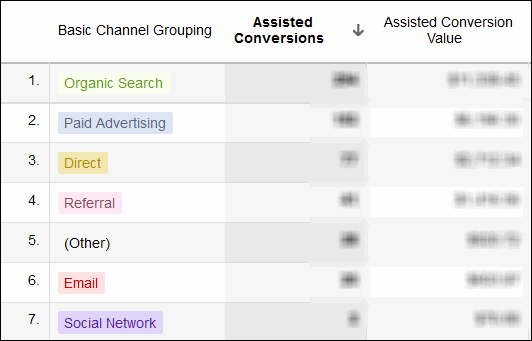
Google Analytics Assisted Conversions Report
This is a great report that’s really flexible. Let’s start to unpack a few pieces here:
This is a great report for helping demonstrate the value of your channel – you can actually show your boss or your client the additional number of conversions your channel is involved in outside of the raw “last touch” conversions.
Additionally, you can carve out a specific rule, or segment of your traffic, to dig into and learn more about, such as a specific banner campaign, an email blast, page on your website, or even matched search query. This is really powerful because you can drill down to a very specific action or traffic source (a blog post you create or a specific search query or keyword you’ve had trouble pin pointing the true value of).
Google Analytics Top Conversion Paths Report
The top conversions path report is pretty slick as well because it allows you to quickly visualize how people are reaching your site, which channels are creating a first-touch interaction that converts well, and which channel combinations work best:
You might learn that your display campaigns are creating a lot of awareness and work to better align some of your other messaging with that campaign, or you might find that organic search drives a lot of paid search and drill in to see which queries are driving assisted conversions but not straight conversions (which might mean that they’re a prime target for some landing page TLC).
Google Analytics Path Length Report & Time Lag Report
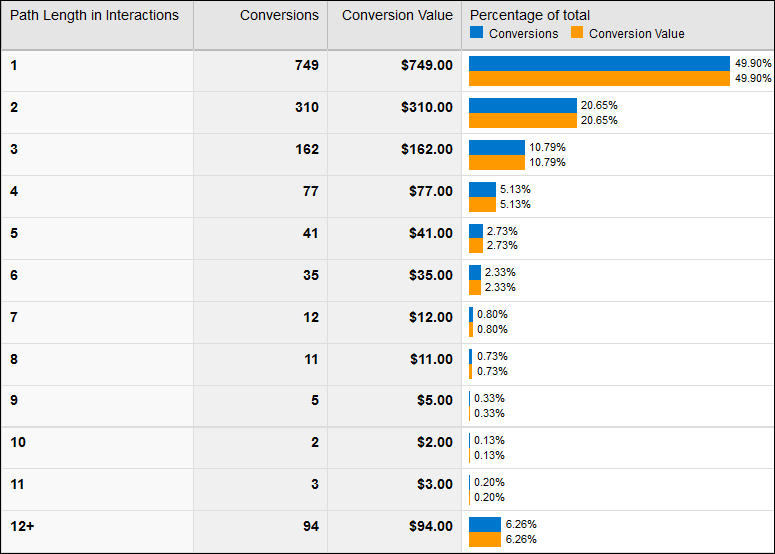
Finally you can pull reports for time length and path length, which give you some great insights into how long your sales cycle actually is, as well as how many touches it takes to close customers on your website:
This can help you understand the distribution of your conversions across the number of interactions it takes to convert someone or the amount of time it takes from their introduction to your site and conversion.
What Can You Do with This Information?
This is a pretty killer feature when you start to apply it granularly to:
- Specific campaigns
- Specific keywords
- Specific content pieces and types
Because you can more accurately value different types of traffic, different content you create, and different segments of your SEO and PPC campaigns. You can also start to strategically align the campaigns that most frequently interact with one-another by better understanding which first actions typically lead to which second actions. You’ll also want to start more meticulously tagging different campaigns so that you can harness the full power of this new feature set. We’re often hard on new Google features here on the blog, but this is a highly valuable addition to Google Analytics that offers a lot of great data and should be a section of analytics you’re regularly leveraging in your optimization efforts.
Meet The Author
Tom Demers
Tom Demers is Co-Founder & Managing Partner at Measured SEM and Cornerstone Content.
See other posts by Tom Demers
More Articles Like This
Comments
Please read our Comment Policy before commenting.


